|
Even clever people think irrationally
There is a temptation to believe that cognitive biases affect smart folk less than they do people of average intelligence. We like to think that others are much more likely to fall prey to illusions and errors in thinking than we are. This is an example of what social psychologists call the primus inter pares effect, and we are all susceptible to it. For example, the majority of us think that we’re better than average drivers (studies show that most people score themselves 7 or above when asked to grade their driving ability between 1 and 10). Mathematically, of course, we can’t all be better than average at something! David Dunning, a psychologist at Cornell University, has studied the phenomenon, known as illusory superiority, for decades. He suggests that although most people will score themselves highly for most positive traits such as IQ, memory and immunity to bias, they will simultaneously recognise the frailties in other people’s abilities, realising that the actions and abilities of others are influenced by personality traits and external circumstances; “but when it comes to us, we think it’s all about our intention, our effort, our desire, our agency – we think we float above these kinds of constraint” So most people would be shocked to discover that everyone, including those whose abilities and intellect we respect most, are just as susceptible to biases, faulty analysis and irrational conclusions as the rest of us. In a famous 1977 study, 94% of college professors rated themselves above average relative to their peers! Statistically, that makes the 6% who didn’t very dumb indeed! Project managers inhabit a complex world and have to navigate a treacherous landscape strewn with pitfalls and traps; inaccurate data, competing priorities and complex diagnostics not to mention contradictory opinions, unrealistic estimates and faulty assessments. In this sense they experience a similar working environment to medical doctors, and like their counterparts in healthcare, the most successful practitioners have developed the ability to think clearly and logically even under pressure, and in doing so ensuring that their analysis of a problem is as sound and reliable as possible. Bear this in mind when considering the following puzzle, and be aware that when presented with this challenge, over 80% of General Practitioners arrived at the wrong answer ... A problem of multiple probabilities In this example doctors were asked to consider a test used to screen for a disease. The test is quite accurate with a false positive rate of just 5%. In other words, 5% of the people who take the test will show as having the disease even though they don’t. (This success rate would be considered more than acceptable in real life situations. For example, in the case of breast cancer screening the American Cancer Society’s website states that ‘About half the women getting annual mammograms over a 10-year period will have a false-positive finding.’) For this puzzle, it was explained that the disease is quite common and strikes 1 in 1,000 of the population. People will be tested at random, regardless of whether they are suspected of having the disease or not. Finally, the test does not produce false negative results, so it won’t indicate that a person doesn’t have the disease when they do. The question was posed as follows: assuming that a given patient's test is positive, what is the probability of this patient actually having the disease? Most GPs answered 95% - in other words, they thought that the chances were that the patient did have the disease. At first glance this answer seems logical, after all the test is 95% accurate isn’t it? So if the test shows positive then the sad news is that the person is much more likely to have it than not. However, the correct answer is 1/50 or 2%. The chances are that they don’t have the disease. If you thought otherwise, then you may have just informed someone that they’re going to suffer from a terrible illness when they’re probably not. It’s the sort of thing we ought to be capable of getting right – but most of us, including most practising doctors, get wrong. Why? At first the answer of 2% seems counter-intuitive. It just doesn’t sound right. This is because we didn’t engage our analytical faculties when calculating the solution, in fact we didn’t do any calculating of probabilities at all, relying instead on mental short-cuts or heuristics to arrive at what seemed to be the obviously correct answer. If you’re one of the minority of people who got the answer right you can skip the next couple of paragraphs, but for the rest of us, here’s how we should have approached the problem: The key piece of data which we should have factored into our thinking is the incidence at which the disease affects the population. In this case it was explained that the illness strikes 1 in 1,000 people. So, imagine that the screening programme took place in a small city and that 10,000 people were tested. We would expect there to be 10 people in that population who had the disease. However, when we screen those 10,000 people we know that we are going to get 5% false positives and no false negatives, in other words we will end up with 500 people indicating positive on the test. Yet we know that of those 500, only 10 people will have the disease. So 10 out of 500 is 1/50, or 2%, in other words, the positive reading made it 20 times more likely that the person tested has the disease. One of the mistakes we make when dealing with puzzles like this is to skimp on carrying out a thorough analysis of the question. Ironically, the smarter we are and the more confident we are in our own abilities, the more likely we are to rush to a conclusion that ‘feels right’. In this case we didn’t pay attention to the two most important statistics i) the fact that 1 in 1,000 people will have this disease, and ii) the fact that the screening is 95% accurate for positive outcomes and 100% accurate for negative results. Instead, we focused solely on the fact that the test was ‘95% accurate’, we latched onto this statistic alone and allowed it to influence our thought process, which led us inevitably, to the wrong answer. Looking at this example in the context of project management; it is most relevant when thinking about risk analysis; what are the chances that this or that will happen and impact the project for the worst. Most project managers are not experts in the day to day operational aspects of the businesses that they’re working in, usually we work with subject matter experts; engineers, surveyors, developers with whom we would consult to help us populate our risk registers and develop mitigation strategies. The lesson from this example is this: all of the smart people you work with are prone to making errors of this kind, even when analysing processes and events that are within their sphere of expertise. Never assume that they haven’t succumbed to a cognitive error or an invalid mental shortcut when they’re providing you with their assessment of risk, impact or probability. Try asking them to talk you through their thought process, you may discover something interesting. The bigger moral of the story is that we are all susceptible to those tempting mental shortcuts. We use them without being aware that we’re doing so, which is why our success rate when dealing with risk analysis is usually poorer than we would admit. Our intelligence, expertise and experience is no defence – unless we are constantly vigilant and on the lookout for cognitive traps. The author and broadcaster Garrison Keillor created the town of Lake Wobegon as the setting for his long-running radio show Prairie Home Companion in 1974. In this fictional town it was said that; ‘All the women are strong, all the men are good-looking and all the children are above average.’ It’s a pity that our projects aren’t all based in Lake Wobegon, that most unlikely of places.
12 Comments
You wanna bet? Most of us don’t go about our business as Project Managers assuming that we are irrational, biased or easily fooled. Quite the opposite, in fact. We feel that we make decisions based on reason, cold analysis and a rational assessment of the available evidence. We believe that one of the skills that makes a Project Manager good at their job is the ability to make thoughtful, coherent and balanced decisions most of the time, in any given situation, irrespective of stress levels, pressure from stakeholders, looming deadlines or stretched resources. But whether we realise it or not, our decisions are often skewed or biased or just downright wrong because we regularly fall prey to cognitive biases, subconscious influences and things that psychologists like to call decision traps. Of course, in everyday life most of us manage OK. We usually don’t see the effects of our irrational tendencies, and in fact, there is evidence that the short-cuts or heuristic thinking processes that we use day-to-day evolved in the past to improve our ancestors’ survival chances. But these evolutionary adaptations of our brains took place a million years ago, when homo sapiens needed very different skills and abilities to survive. So what about now, how does this legacy of mental capability affect us in our modern work lives? What if our inability to think and act rationally impacts the decisions that we take while we’re engaged in our business of project management? Is it conceivable that some of the problems we face when coordinating teams, assessing risk, estimating tasks, devising schedules or communicating with stakeholders could be down to errors in the way that our brains actually work? If you’re anything like me you’re probably thinking “Well, I can see how that might be an explanation for the issues some of my colleagues face, but I don’t think it applies to me, I’m fairly sure that I approach things in a pretty rational way, I’m a ‘reason and logic’ kind of person, I don’t think I’m easily fooled or misled.” And you may well be right, but statistically it’s unlikely, for reasons that I explain more fully in this book. (See the chapter No one is immune). For now, let’s look at a couple of simple examples that might just catch you out. In the preface to his best-selling book Inevitable Illusions, Massimo Piatelli-Palmarini illustrates just how easily we find ourselves believing bizarrely incorrect facts without realising it, indeed, without giving these ‘facts’ much forethought at all. He uses examples from geography to illustrate what he likes to refer to as mental tunnels. Here are a couple of them to think about; Losing my sense of direction These examples work best for people with a basic knowledge of the geography of the United States, Italy or the United Kingdom. Let’s start with the American example: Imagine you’re in Los Angeles and you take off in a helicopter to head to Reno, Nevada. What direction do you think you would need to fly in? Most people, even most Californians, guess that it would be North and East, perhaps a heading of 10 or 20 degrees East. (Don’t look at a chart just yet.) Now, for the Brits, imagine again taking off in a helicopter from Bristol. If you head immediately North and fly towards Scotland what major Scottish city would you end up flying over first? If you’re a Londoner, imagine taking off from Heathrow and heading directly North, what is the first Northern English city you’d fly over? The prevailing answers are Glasgow and Leeds, respectively. But, as you might suspect, they are entirely incorrect, as is the answer that most Americans give in response to the Reno question. The correct answers are as follows; Reno is actually North and West of Los Angeles, 20 degrees West to be precise. The first city you’d fly over if you were heading North from England’s ‘West Country’ city of Bristol is actually Edinburgh on Scotland’s East Coast. Similarly flying due North from London has your helicopter passing Hull on the left before crossing the coast onto the North Sea. You’d barely get within 100 km of Leeds. Native born Italians are used to seeing the map of Italy drawn at an angle running from North West to South East, but even so they are generally fooled into thinking that Trieste is some 20 or 30 degrees East of Naples, it being on Italy’s Eastern border with Slovenia and Naples being on the West Coast. But, of course, they’d be wrong. Trieste is, in fact, just West of Naples. Now you can check these out on the charts, Google Maps will do. While you’re at it amaze yourself with these other facts: the first country you’d fly over if you headed directly South from Detroit is Canada. Rome is North of New York City. Don’t be disappointed if you answered all of these questions incorrectly, most people do. It’s not because you’re bad at geography or because you don’t know your East from your West. The actual explanation is that your mind played a trick on you. Without your knowing, your brain rotated the mental image of these maps to align any more-or-less vertical land masses with a North South axis. No one fully understand why this is, we don’t know, for example, why no one rotates the land mass of Italy horizontally, it’s always straightened vertically in our minds, as are the British Isles and the Western Coastline of the United States. Piatelli-Palmarini refers to these as cases of tunnel vision and I’m indebted to him for these examples. They illustrate very elegantly how our brains sometimes work on a problem in our subconscious and present us with false conclusions without our even realising it. But these instances are relatively benign and need not alarm us unduly. For more examples that perhaps ought to alarm us, read on. Do your eyes deceive you? If we’re fortunate enough not to suffer from a serious visual impairment, we probably trust our eyes more than any of our other senses. They are generally in use from the minute we wake up to the time we close them again to go to sleep. Most of us are highly resistant to the idea that our vision might regularly play tricks on us, even though we’ve seen stage magicians fool people on television many times, we have an almost unshakable faith on our own ability to discern reality from illusion. So what colour was that dress? If you pay attention to such things, you may remember a furore in social media about a celebrity whose dress appeared as to be different colours to different people? Some thought it was black and blue, others white and gold. I recall asking myself at the time how could it possibly be that different people had an entirely different impression of the same photograph. I wondered if it was their eyes or their brains that were interpreting the visual data differently. In the example below there are two images of a woman wearing a dress. Do they appear to be the same colour to you?  For most observers, the dress on the left is a shade lighter than the one on the right. Similarly, the olive brown colour at the top of the dress is slightly darker on the right than it is on the left. The two dresses are, in fact, exactly the same colour. But it doesn’t seem to matter how long you stare at the picture, even if you believe it to be true you can’t force your eyes to see them as being identical. The blue and brown on the left hand dress always seems lighter than the one on the right. All good project managers are somewhat skeptical in nature (and you have every right to be) so for those of you who don’t believe it, here is a modified version of the picture to help you convince yourself of the facts of the matter. Fifty Shades of Grey? In another well-known version of a related visual illusion we see two squares, in this case labelled A and B, which are clearly different shades of grey. You would probably find it very difficult to believe that the squares are exactly the same colour and that your eyes – or more correctly your brain – is fooling you into thinking that one is lighter than the other?  And yet that’s precisely what you’re not seeing. In this example of the shadow illusion squares A and B are identical in both colour and shade. Yet knowing that this is true is of no help when you try to see them as the same colour. The presence of the cylinder casting an apparent shadow over a chequer board helps to fool your brain into creating a visual perception of the squares in which square A is significantly and obviously darker than square B. In fact, the only way you can be convinced that they are the same colour is if you completely mask out the other parts of the image to reveal only the two squares in question. Try printing this blog page and cutting squares A and B out then laying them side by side, I promise you that you'll be amazed. Rubik’s Magic Cube The final example is perhaps the most astonishing of all. Below is an illustration of a 5- row version of Ernő Rubik’s famous cube. Two squares are highlighted, A, I think you already know what’s coming ... 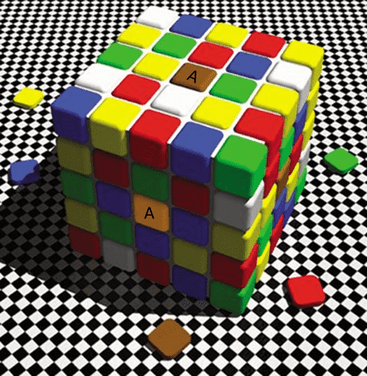 Yes, the ‘yellow’ square A and the brown square A are actually the same colour, and it’s brown. The illusion is exquisite in that your brain has made the square on the shaded face of the cube yellow. But it’s not, it is in fact, brown, (R145 G89 B32 to be precise). The bars extending out to the side of the squares in the version of the illustration below helps us to see the colours as they ‘really are’, but take care, if you permit your eyes to wander back towards the centre of the picture you may notice the bar on the left lighten again, and by the time you find yourself looking at the lower square it may even look yellow once more!  Although we may use the expression ‘our eyes have deceived us’ we know that it is, in fact, our brains that are the cause of the problem. Our eyes are the just the sensors that detect electromagnetic radiation in the visible spectrum and convert it into electrical impulses. These electrical stimuli are then sent along the optic nerve to the visual processing part of the brain. This is the primary visual cortex — a thin sheet of tissue located in the occipital lobe in the back of the brain.
Thanks to technological advances such as fMRI scanning, we now know that different areas of the brain deal with different aspects of visual interpretation such as colour, shape, lines and motion. Just how the brain deciphers this information to present us with our experience of the ‘real world’ remains poorly understood. It would seem that our brains have a lot to answer for, and, as project managers, visual illusions are the probably the least of our concerns. Yet they serve as useful metaphors for the challenges that our brains face when trying to make sense of the complex world we live and work in, a reminder that we need to be constantly vigilant if we are to avoid being fooled. How framing can change everythingAs project managers we spend a lot of time asking questions. It is important that we understand that how we ask a question can have a profound influence on the answer we will be given. When we ask a colleague for a progress update, or to assess a risk, or even to let us know whether they are happy with the manner in which the project is being managed we are providing information, in the form of the words that we use, which may influence the answer that we receive. Framing effect The framing effect is a type of cognitive bias where people can be influenced into giving different answers depending on how a question is presented. Some of the most interesting examples of the framing effect can be found when decisions are being made about risk and it is for this reason that a basic understanding of this psychological phenomenon is crucial for project managers and business executives. The prevailing theory suggests that people are more wary of risks when a positive frame is presented but are more accepting of risks when a negative frame is presented. To better understand what this means in practise, consider this example from a paper published by Amos Tversky and Daniel Kahneman1 in 1981: The study looked at how different question phrasing affected participants’ decisions in a hypothetical life and death scenario. The participants were asked to choose between two medical treatments for 600 people who had been affected by a lethal disease. The treatment options were not without risk. Treatment A was predicted to result in 400 deaths, whereas treatment B had a 33% chance that no one would die but a 66% chance that everyone would die. This choice was then presented to the participants in two different ways; one with ‘positive framing’ - how many people would live, the other with ‘negative framing’ - how many people would die. The results were as follows:  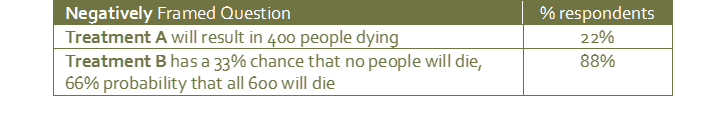 Treatment A was chosen by 72% of respondents when it was framed positively, but treatment B becomes the overwhelming preference in the negative frame, demonstrating that people are much more accepting of risks when the decision is framed negatively. Of course, in this example, there was no material difference between the risks involved in either treatment! Fooled by framing – always ‘do the math’ Question framing can also be the cause of curious cognitive difficulties. For example, we are easily confused by questions that are framed using inappropriate units of measure. Consider the following:
The answer to the question seems obvious; both Margo and Jake are driving 10,000 miles per year. Margo is only going to achieve an additional 2 miles per gallon whereas Jake is going to improve his consumption by 10 mpg. It seems that we don’t even have to ‘do the math’ – Jake is clearly going to be the winner and save the most. Except he isn’t, Margo is. We have to do the math. In driving 10,000 miles in her new Mustang, Margo uses 714 gallons of fuel. Previously her gas-guzzling Corvette used 833 gallons to cover the same distance. So she’s saved 119 gallons in her first year. Jake, on the other hand, will save only 83 gallons. His old Volvo used 333 gallons to cover 10,000 miles and his new, improved, Volvo will use 250. So although Jake’s fuel consumption has reduced by 25% and Margo’s by only 14%, Margo is still ahead in terms of savings. This is because her cars are so inefficient in comparison to his that a mere 14% improvement is still a lot more fuel! Most people are caught out by the question so don’t feel too bad if you were too. But the more interesting discovery is this: if the question is re-framed so that instead of presenting the fuel consumption measure as miles per gallon it was shown as gallons per mile, we would instantly see that Margo was going to save the most fuel. Try it. When discussing business issues involving KPIs (Key Performance Indicators) we should always bear in mind the importance of framing and measures. The health of a business (or of a project for that matter) is often communicated to stakeholders in the form of KPIs. You will be familiar with system dashboards that show, for example, sales growth, sales per employee, percent of target reached, debt to equity ratio, margin by product etc. When reviewing this sort of data while discussing KPIs, bear in mind that perception of performance can be profoundly influenced by the measures used. You may not want to promote Jake as a result of his upgrade decision, after all, Margo did save the company the most money! The Challenger Shuttle Disaster Every now and again a project failure occurs which is so devastating that it attracts the attention of the entire world. On January 28, 1986 the NASA space shuttle, Challenger, took off from a launch pad at Kennedy Space Centre. 73 seconds later it exploded instantly killing its crew of seven. The night before the launch a number of engineers at NASA contractor, Morton Thiokol, had tried to stop the launch on safety grounds. Their analysis of the weather conditions and their understanding of the temperature sensitivity of the booster rockets’ hydraulic systems had a resulted in the assessment that it was too risky to proceed and that the launch should be delayed. The management team asked the engineers to reconsider and to look at the potential costs, both financial and in Public Relations terms, of the launch not proceeding. The managers set out a number of factors for the engineering team to consider including the fact that President Ronald Reagan was set to deliver a State of the Union address that evening and was planning to tout the Challenger launch. The engineers reconsidered. With the question now re-framed to highlight the negative consequences of not launching they eventually agreed that the launch should proceed. NASA’s management team had succeeded in changing the frame of the question so that the cost of not launching carried more weight than the risk of launching. Despite it being the coldest weather Kennedy Space Centre had ever experienced for a shuttle launch, it went ahead. It seems that the engineers were very wary of the risks when the launch was presented in a positive frame but were persuaded to be more accepting of the risks when they were set out in a negative frame. This tragic example highlights how even the most experienced and qualified professionals can be influenced to assess hazards differently when the risks are framed in a certain way. This is not to understate the immense pressure the engineers faced from their superiors (who had a vested interest in achieving the launch date). The lesson for project managers is that if this can happen at NASA it can happen in any project. The more we understand about how people arrive at their assumptions with regard to risk, the more we can do to ensure that their conclusions are logical and rational. How we are prone to making bad decisionsAs project managers we are used to making decisions and most of us would acknowledge that the ability to make the right decisions at the right time is one of the most important factors influencing the outcome of a project. Of course, not all of our decisions turn out to be the right ones, we are only human after all, but we’d like to think that we make more correct decisions than we do wrong ones. More importantly, we like to think that we get the big decisions right most of the time, so we pay special attention to mission-critical aspects of the project such as risk management, task estimates, team selection and milestone planning to ensure that we make them logically and rationally. But what if making rational and logical decisions is more challenging than we think? What if our choices could be influenced in one direction or another without our even realising it? Let us step out of the world of project management for a moment and into an environment that will be instantly recognisable: the supermarket. You may be familiar with product price labels that look something like this: Sauvignon Blanc Was £7.99 Now £4.99 And despite our best efforts to employ our critical faculties, when we see a label with this sort of offer we cannot help but think that we would be buying a premium product at a discounted price. Retail marketing and product placement gurus have long understood how important and influential our desire to make comparisons is to the decision-making process. The technique is employed in many situations which the supermarkets hope will assist us in making the ‘right’ decision but which actually highlight just how irrational our decision-making can sometimes be. Consider the following set up:  When presented with three comparable products at different price points most of us tend to pick the mid-price product. Some of us may pick the cheaper or the more expensive options and these choices will be influenced by a number of very rational considerations including how wealthy we feel and what our standards and quality expectations might be. However, an interesting phenomenon occurs when a fourth product is included in the selection:  Research has shown that when another, more expensive, option is introduced, a significant number of shoppers who previously would have bought the mid-price product instead opt for the next most expensive one. Somehow the addition of a premium option – which is usually significantly more expensive – tricks us into thinking that the next most expensive product offers the best value for money. If we were happy to spend a certain amount on a bottle of wine, why should the addition of a very costly bottle to the shelf cause us to change our minds and spend more money? This does not seem rational, but the example does provide a clue about the processes that our brains employ when making comparative decisions. Comparisons, relativity and default settings In his ground-breaking 2008 book Predictably Irrational, Dan Ariely showed how easily a person’s choices could be manipulated without their being aware. In a chapter entitled The Truth About Relativity he introduces a concept known as the ‘Decoy Effect’ using an example like this one: You are offered two options for a romantic vacation for two; a free, all-expenses paid trip to Paris or an equivalent all-expenses paid trip to Rome, which would you choose? Your answer would most likely depend upon your preferences in terms of art, culture, food and entertainment. Some people may opt for Paris and some for Rome and in a large enough sample group we might expect the split to be about half and half. However, if a third option is added, in this case also a trip to Rome but without a free breakfast included, a strange thing happens: more people choose the all-expenses paid trip to Rome over the all-expenses paid trip to Paris. No one chooses the inferior trip to Rome without breakfast, of course, but why does the presence of a third, inferior option cause people to gravitate towards Rome rather than Paris? The explanation may be that the presence of a ‘decoy’ makes it easier to compare the two options for Rome than to compare Paris with Rome. This decoy effect (also called the asymmetric dominance effect) is a phenomenon that causes people to have a change in preference between two options when presented with a third option that is related to, but also markedly inferior to, one of the original options. The presence of a decoy option results in an irrational decision. In this case Rome now looks like a better option than Paris despite no new information about Rome or Paris becoming available to the consumer. This kind of irrational decision making is not limited to the ordinary consumer; it is apparent that we are all prone to subconscious influence by decoys. Even expert professionals, when evaluating critical decisions, are susceptible to making illogical choices. In a study carried out in 1995, researchers Donald Redelmeier and Eldar Shafir illustrated how experienced medical doctors could, under certain conditions, be influenced into selecting an inferior treatment course for patients suffering from chronic pain: The first scenario presented to the doctors was as follows: You are reviewing the case of a patient who has been suffering from hip pain for some time and has already been scheduled for a hip replacement. However, while examining the case notes ahead of the surgery you realise that you have not yet tried treating the patient with Ibuprofen. What should you do: (a) leave the patient to undergo the surgery, or, (b) delay the operation until a course of Ibuprofen has been undertaken? In most cases (you will be pleased to know) the doctors delayed the surgical intervention and recommended that the patient be prescribed a course of Ibuprofen. In the second scenario, another group of physicians was presented with a similar case but this time they were told that two different medications had yet to be tried: Ibuprofen or Piroxicam. This time, most physicians opted to allow the patient to continue with the hip replacement! It seems that because another decision factor was added and the choice made more complex, many more doctors allowed the default option to stand. To better understand this example it is important to realise the role played by the default option. We need to bear in mind that the patient was already scheduled to have a hip replacement. The choice was not ‘Which of these many treatment options is best?’ but rather ‘Do I make the decision to change the current course of action in order to try something different?’. It appears from numerous experiments like this one that if multiple or complex choices are available then the tendency is to leave things as they are. Only when a simple alternative is presented is it likely to be selected – even if the alternative choice would have been the more logical thing to do. As a project manager and business owner I have seen decision situations like these arise many times. While directing a large ERP (Enterprise Resource Planning) system installation some years ago my implementation team was presented with a sudden resourcing crisis after half of our implementation consultants were removed from the project at short notice. With the scheduled ‘go-live’ three months away and with little prospect of completing all of the application testing and user training in time we were faced with a simple decision: (a) should we proceed with the project as planned and hope that, by redoubling our efforts and with a fair wind (and some luck), we are able to deliver a workable system, or, (b) do we change the scope of the project so that only a subset of the overall functionality is delivered to begin with, and thereafter initiate a new project to implement the remaining features. At a core team meeting we discussed both courses of action in detail and decided on the latter option: to reduce the scope of the project in order to meet the scheduled date, albeit with a reduced set of system functions. I duly presented this as my recommendation to the CEO of the business at the next project board meeting. There was much discussion between the various stakeholders after which another option was suggested: why not recruit implementation specialists from outside of the business so that the go-live date could still be met without the scope of the project being reduced? I didn’t relish the thought of trying to find a handful of consultants with the appropriate expertise in our chosen ERP application at short notice, but I agreed to take the idea back to the core team for further consideration. The core team representatives now discussed the three options and very quickly arrived at a decision: the team preferred to redouble their efforts, plough on, and hope for the best. I was astounded! It seemed that the complexity of the decision-making process had now increased to the point where it was just too difficult to weigh up the pros and cons of each option. No one knew how best to go about recruiting additional implementors and some members of the team decided to reconsider the feasibility of dropping some functional elements from the scope. The easiest option seemed to be to do nothing, and to let the project unfold according to its original schedule, in other words, to accept the default position. What originally seemed like a simple decision had turned into a complex one by the addition of a challenging, third option. The validity of the choice to proceed with a reduced scope had not altered, but the team’s perception of the choices available had changed significantly enough for them to retreat and backtrack. (Of course, for the record, I did not allow the decision to stand, but that’s not the point of the story.) Dan Ariely provides another salient example of the importance of default options in a case study featuring an analysis of Organ Donor programmes in Europe from 2009.  The chart above shows the percentage of the eligible population who agreed to carry an organ donor card when applying for their driving license. On the left of the chart are the countries with the lowest participation rate: Denmark, the Netherlands, the United Kingdom* and Germany. On the right are the countries which subscribe to the scheme on an almost universal basis. It is worth noting that in order to persuade its population to carry more donor cards, the Dutch government wrote a personal letter to every single eligible citizen and asked each one to participate in the scheme. The result was a significant uptake in membership to 28%. It is not obvious from an initial analysis of the data why there should be such a marked variation between countries. Cultural and social differences do not seem to explain it, after all, one would expect Germany and Austria to have similar values, and it is hard to imagine attitudes in the Netherlands being dramatically different from, say, Belgium. But participation in the organ donor scheme is dramatically different between these countries. So why do only 4% of Danish drivers carry organ donor cards when 86% of their near neighbours in Sweden carry them? The answer lies not in the ethical or moral attitudes of the respective populations but in a simple administrative oversight. The countries with the poorest participation in the scheme provided driving license applicants with a form containing the following question:  Whereas the countries with the best participation in the scheme used the following question: 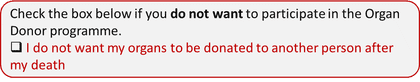 In both cases the default option is to do nothing by not ticking the box. By doing nothing in the first case you opt out of the scheme, by doing nothing in the second case you opt in to the scheme.
When faced with a choice, people are strongly drawn to the default option, the default option usually being the one that requires the least effort or consideration. That this sort of question framing should influence people’s decision-making to such a degree is fascinating to say the least, especially so given the nature of the choice being made in this particular example. It also raises an important question: if framing can so easily influence us when it comes to making such important decisions, then how easy must it be to sway us when we don’t perceive the stakes to be so high? * From 1st December 2015 the system in England & Wales was changed to an ‘opt-out’ for this very reason |